UK is the only country to show complete mortality data on the benefit-risk balance of Covid vaccination
October 30, 2023
The official mortality data from the British Office for National Statistics (ONS) from August 2023 shows one of the most important data sets since the start of Covid vaccination.
The UK appears to be the only country in the world to provide complete data on all-cause mortality by vaccination status for the population. This makes it possible to estimate the benefit-risk balance of Covid mRNA.
All-cause mortality reflects the risk-benefit balance
All-cause mortality is one of the most meaningful parameters. In this case, manipulative or euphemistic interventions in the evaluation can be largely ruled out.
The UK's ONS data by vaccination status are now the best yet to show the impact of mRNA vaccination on mortality rates.
Undetected vaccine side effects are included in all-cause mortality
All deaths are taken into account, regardless of the type of death. For this reason, the possible, but difficult to determine deaths due to the countless and often unrecognized vaccine side effects also come into play. All-cause mortality thus takes into account the overall benefit-risk balance of mRNA vaccination on all-cause mortality. Even if the mRNA vaccination would reduce the number of Covid deaths, the deaths from vaccine side effects would be offset against it.
Only with this large and complete dataset can it be seen how vaccinated or unvaccinated affects all-cause mortality.
The results are so clear that they cannot be explained away.
Unique UK data - other countries withhold data
All other governments in the world seem to be withholding this data.
In other countries, researchers and the public do not have access to such mortality data. People can't know the truth that way. Taking into account the overall benefit-risk balance, governments are obviously willing to accept more deaths with these vaccines than without.
The data shows the exceptional transparency of UK data compared to other countries. In this respect, the British are far ahead of the rest of the world. The UK ONS is the exception in terms of data transparency and methodology. Other countries can follow the example of how this should be done and reported.
Complete data for all age groups
No other country other than the UK has publicly available mortality data that allows for age-stratified assessment by vaccination status. To this end, the entire population must be covered as completely as possible. The vaccination status must be systematically indicated on the death certificate. The UK has an official body, the Office for National Statistics (ONS), which provides such usable datasets. Only when the different age groups are taken into account can result-distorting statistical effects such as the Simpson paradox or the Pearson effect be ruled out.
The benefits of ONS data at a glance
Data of the entire English population with all deaths
Fine-grained and complete according to vaccination status of 0-4 vaccine doses
Vaccination status Population proportion adjusted per 100,000 person-years
Age-stratified fine-tuned across all age groups from 18-90plus years excludes distorting Simpson effect
Altersstandardisiert
Calculation by person-years takes into account the different vaccination status of persons on a pro rata basis
Recording of all-cause mortality (and not just "evaluated" PCR Covid deaths) shows the overall benefit-risk balance of Covid mRNA vaccination
Undetected vaccine side effects are included in all-cause mortality
ONS data graphically illustrated
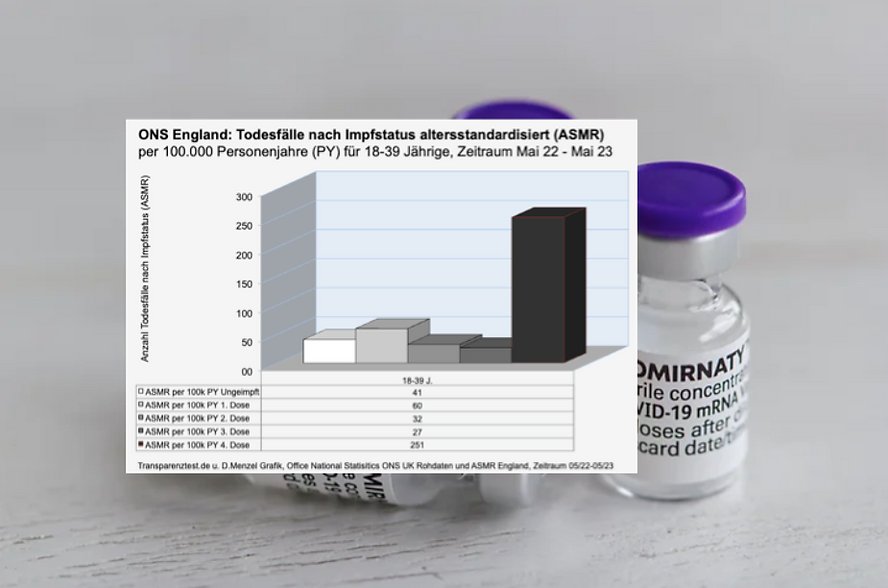
Tt has graphically illustrated this current available ONS data. They refer to the deaths in the English population for the period of one year from 05/2022-05/2023. The Tt graph clearly summarizes the values of ONS Table 2 in a bar chart.
The ASMR mortality rates are given proportionately adjusted per 100,000 person-years according to vaccination status, finely graded age-stratified across all age groups.
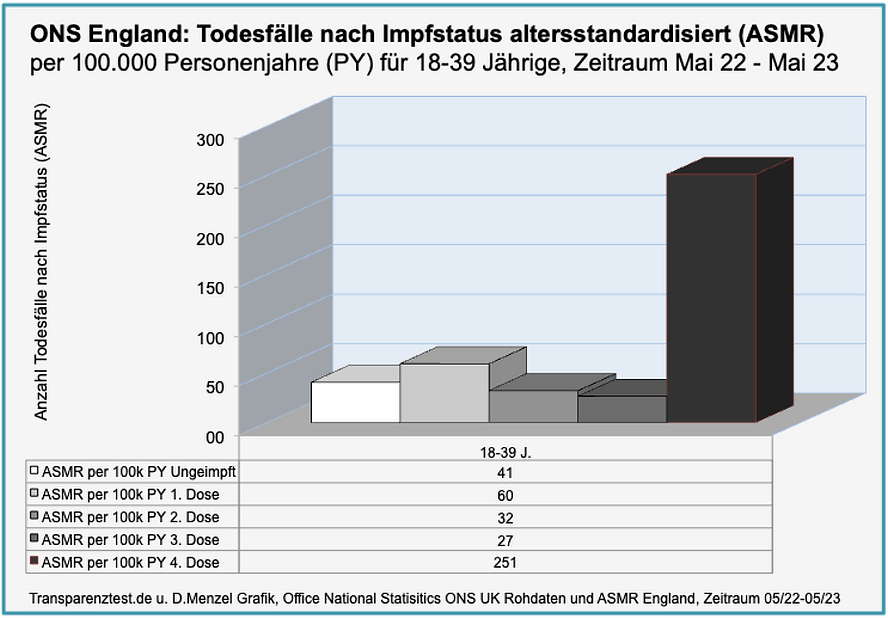
ONS England: Deaths by vaccination status Age group 18-39 years
Strikingly high values in younger people who have been vaccinated 4 times
In the youngest age group of 18-39 years, the much higher death rate among those vaccinated 4 times compared to the unvaccinated is striking. In the 18-39 age group, there are 6 times as many deaths
Fatal side effects of heart disease such as myocarditis come to mind. These affect younger people in particular, e.g. during sports activities.
ONS England: Deaths by vaccination status Age groups up to 70 years
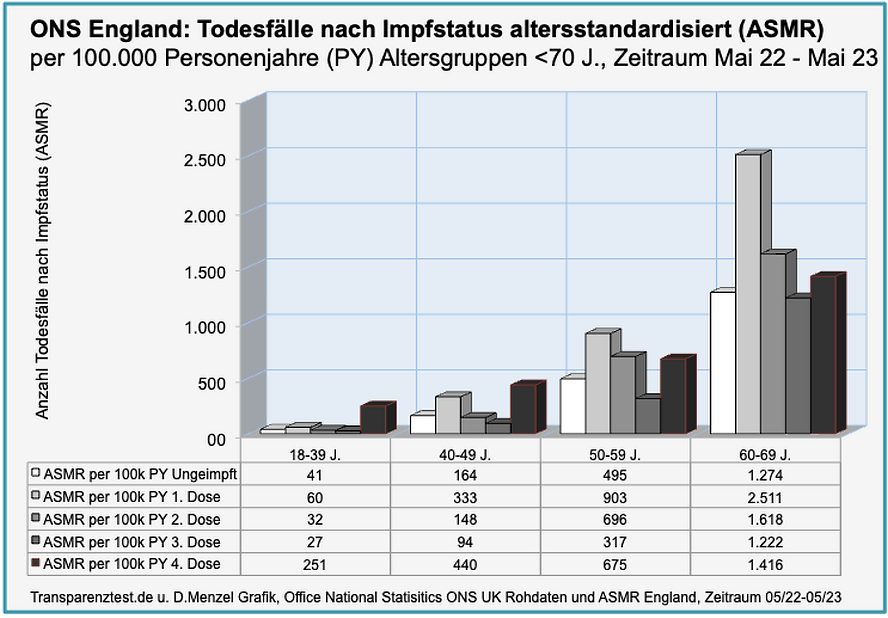
In the 40-49 age group, there are 4 times as many deaths among those who have been vaccinated 4 times as among those who have not been vaccinated. Even among the 50-59 year olds and 60-69 year olds, disadvantages of the vaccinated are increasingly recognizable.
ONS England: Deaths by vaccination status across all age groups
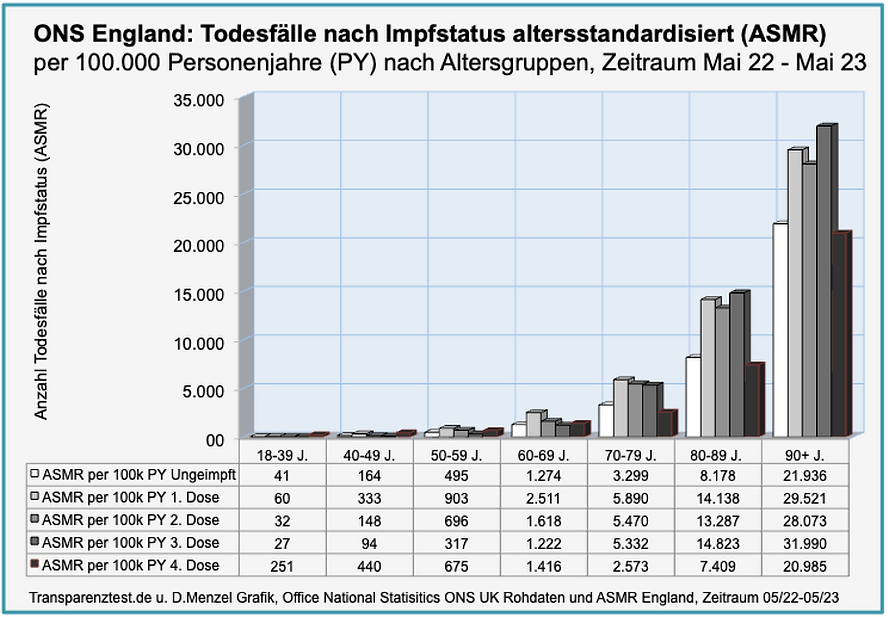
The graph shows the population-adjusted death rates for the unvaccinated compared to vaccinated people with 1, 2, 3 or 4 vaccine doses. This is done for all 7 age groups for 18 year olds to under 40, 50, 60, 70, 80 and 90+ year olds.
Result: More Covid vaccinated people die - 1-fold, 2-fold, 3-fold and 4-times vaccinated - than unvaccinated across all age groups.
In the case of the group of people with 4 vaccine doses, it can also be assumed that data are still pending or that deaths due to the reporting delay will still be received over time. As a result, the rate for those vaccinated 4 times is expected to increase (although the ONS will not report further on this as it has stopped reporting with immediate effect).
In absolute terms, deaths increase with age, and consequently, according to these objective mortality data, it is precisely those people who should be particularly protected by vaccination who die.
We have already reported on the results (with explanations for comprehension) elsewhere here .
Mortality rates prove correlation, not causation
As clear as these mortality data of the English population are, they cannot prove causality regarding the influence of vaccination.
It could be, for example, that the people who get vaccinated are inherently more at risk and sicker than the people who prefer to remain unvaccinated.
Such bias cannot be ruled out with certainty with any study. However, this is the entire data of the English population. For this reason, these extensive data cast a bleak light on the risk-benefit ratio of Covid vaccination.
Transparency Test Summary
No comparable data available from Germany
The ONS data is so important because no comparable data are available here in Germany or in other countries. In Germany, the reason is, among other things, that the vaccination status on the death certificate was not approved for - presumably pretended - reasons of data protection - unlike in Great Britain. This means that the influence of vaccination cannot be traced via official statistics for the German population.
One can only dream of such data in Germany: At the RKI, sometimes only 4% of Covid deaths have symptoms and clear vaccination status . You can't do anything with this incomplete data.
Not perfect, but fundamentally meaningful ONS data
No data is perfect. Neither does the ONS data. They still have some bugs. For example, the number of unvaccinated people is still understated (see criticism by Prof. Norman Fenton). However, the way in which the data was analysed and reported is methodologically correct, complete and transparent.
Devastating result for Covid vaccination
The result is devastating for the Covid vaccination. There are no benefits whatsoever for vaccinated people in the overall benefit-risk balance. On the contrary, the results indicate a massive impact of the side effects at the expense of the overall benefit-risk balance. If the Covid mRNA vaccination has a positive effect, the side effects seem to exceed it.
Taking into account the vaccination rate, vaccinated people die more often than unvaccinated people.
This is generally true in all age groups from 18 to 90 years.
The results show up in both 1-, 2-, 3-fold and 4-fold vaccinated compared to unvaccinated people.
In absolute numbers, the group of older vaccinated people, who should be particularly protected with the vaccination, are also dying more often.
Important : These data show all-cause mortality for all causes, including cardiovascular disease, cancer, etc. They also apply to the entire population of England.
It is therefore not a good sign that there are still more deaths per 100,000 among vaccinated people.
Our TT questions:
Why doesn't the media and politicians notice that only in the UK is there such complete and methodically well-collected data?
Why don't the EMA and national regulatory authorities provide such data?
How can it be that in the case of deaths, data protection is put in the foreground and therefore the vaccination status may not be indicated?
We can't do it without you!
Our goal is to sensitize us all to more transparency and evidence.
We citizens have an inalienable right to know what is decided, when, how and for what reasons - without our consent. Since the information is rarely given completely and comprehensibly, we have to stay awake and ask.
Strengthen us with a small contribution, so that we can demand this from those responsible with your support.
We would like to take this opportunity to thank you very much for this, as we are not allowed to respond to donations for reasons of data protection.
Click here
https://www.transparenztest.de/unterstuetzen
Follow us on
https://twitter.com/transparenztest
https://t.me/transparenztest
https://gettr.com/user/transparenztest
Sources:
https://wherearethenumbers.substack.com/p/the-office-for-no-more-statistics
https://wherearethenumbers.substack.com/p/the-ons-data-on-vaccine-mortality-is
Unsplash: Guido Hofmann
Graphic: Transparenztest.de and D. Menzel


